Create and Publish vector data from scratch
18 Jun 2016This post shows how to create a georeferenced vector dataset from scratch an publish it as a layer on a web map.
Basically it explain how to, in sequence
- Draw georeferenced geometries called features over a map background taken from one of the most popular free map tiles services
- Build up a simple geospatial infrastructure from scratch
- Use the WFS protocol to easilly keep the features updated
Perhaps you are now wondering…
- Aren’t there enough good online maps-maker tools out of there?
- Why should I learn how to do it from scratch?
- Why should I have to deal with GIS software and Linux instead of simply use an online map maker?
Well, try to bring out the best from Mapbox and CARTO but if after that you still need more control over the overall map creation or simply you want to avoid fees… check this post out!
##The whole process in 3 steps
As just said before, we’re going to break the process in 3 main steps:
-
Layer creation We will create a georeferenced vector dataset built of many featuresexporting it as a shapefile.
-
Layer publication Let’s use some cool DevOps tools to build up in 10 minutes a production Linux server with GeoServer, PostGIS, GDAL ready to host and serve our custom geospatial data.
-
Layer update with QGIS and the WFS protocol we can update vector layers published on a remote host as it was hosted locally.
Layer creation
### Let’s draw some vector data
First of all we need QGIS so download and install it.
With QGIS we can create any Geometry like
Points, Lines and Polygons
as we can do with any other traditional vector desktop software like Inkscape or corel Draw… but the cool QGIS thing is that if those geometries have a location on the earth (for example they are the shape of a country or a neighborhood) we can automayically assign the coordinates to all the vertexes.
Since each Geometry represents a spatial feature we can also set a couple of Attributes.
1 minute quick-and-dirty tutorial
It’s quite easy to activate the QGIS drawing tools and start drawing a polygon but…
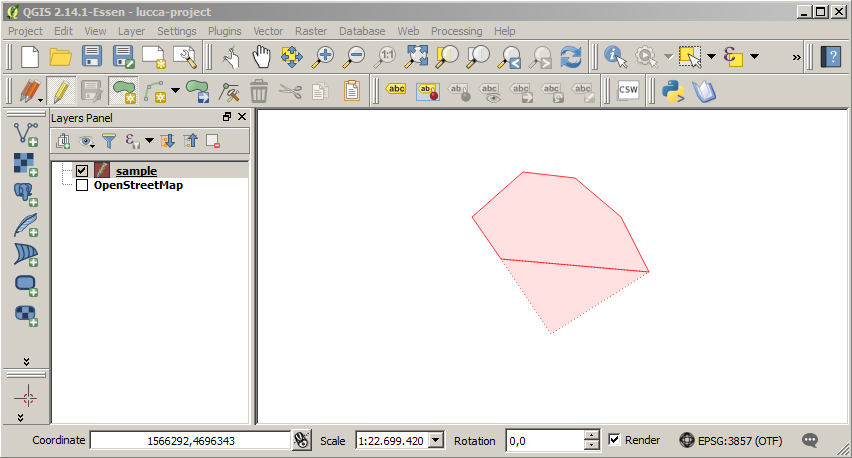
…Where are we drawing it? How the spatial location of that geometry can be managed?
well, now we can start to talk for hours about things like map projections and reference systems… but let’s make the long story short and build something quick…
In QGIS we can easilly install the OpenLayers plugin that allow us to set in the workbench a layer we use only as background:
Among the others we can use OpenStreetMap:
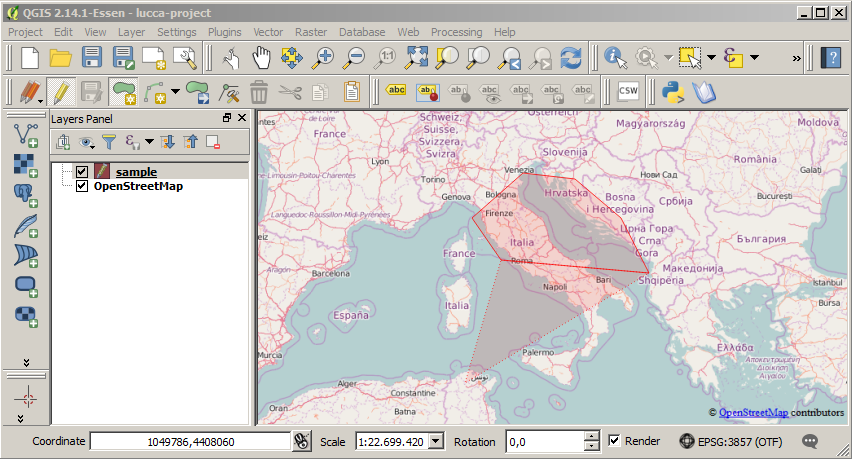
So answering to the previous question we are drawing a polygon over Italy!
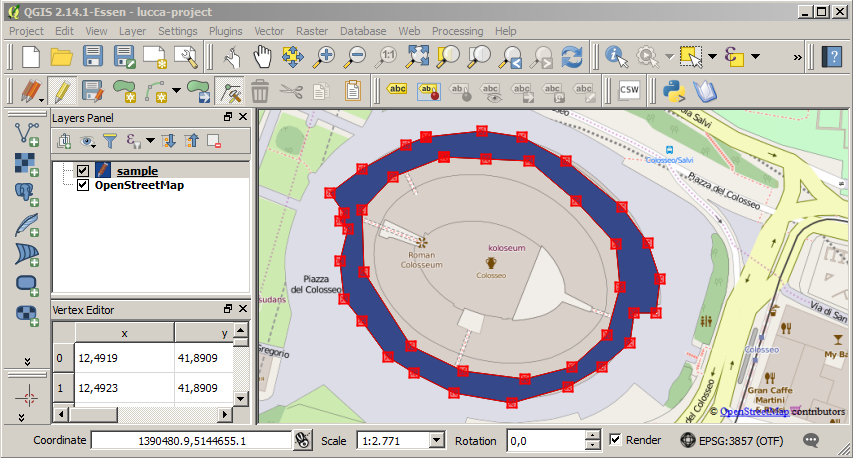
And here we have drawn a polygon around the colosseum:
###5 minutes tutorial ( maybe 10 )
Assuming that you have a recent QGIS release already installed and an internet connection:
-
Install the QGIS OpenLayers plugin:
From the top menu select
Plugins->Manage and Install Plugins...In the Search input type
openlayer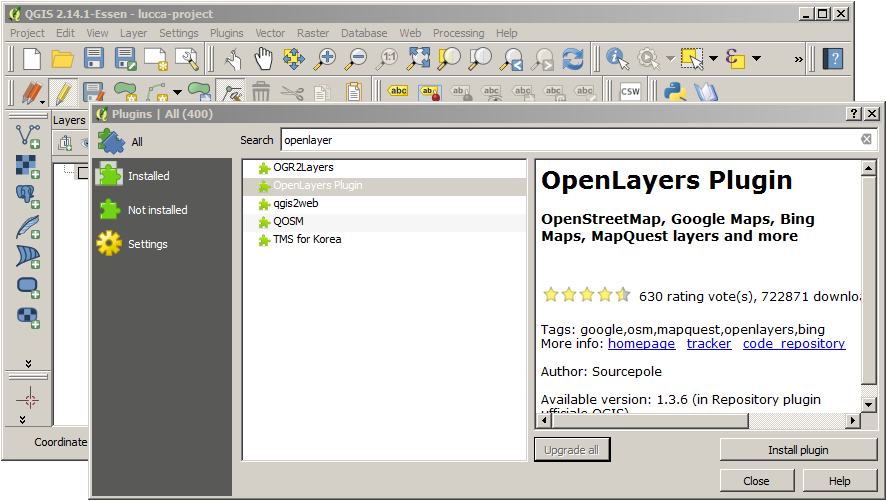
-
The top menu
Webis now available.Load the OpenStreetmap layer to set a QGIS workbench reference background to draw our features
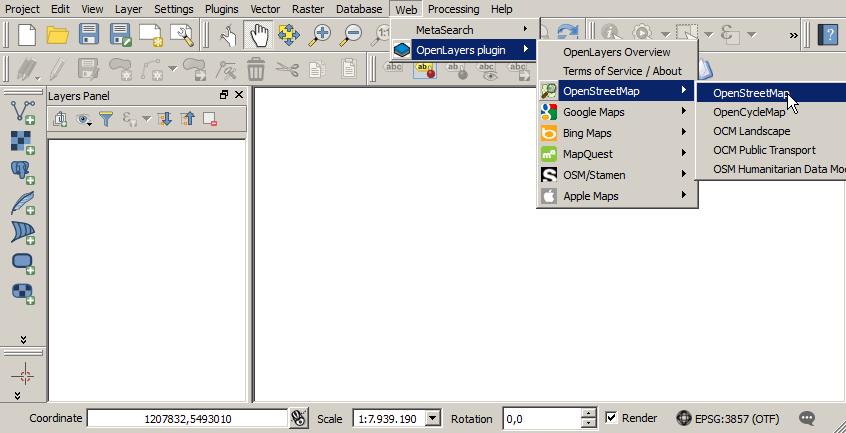
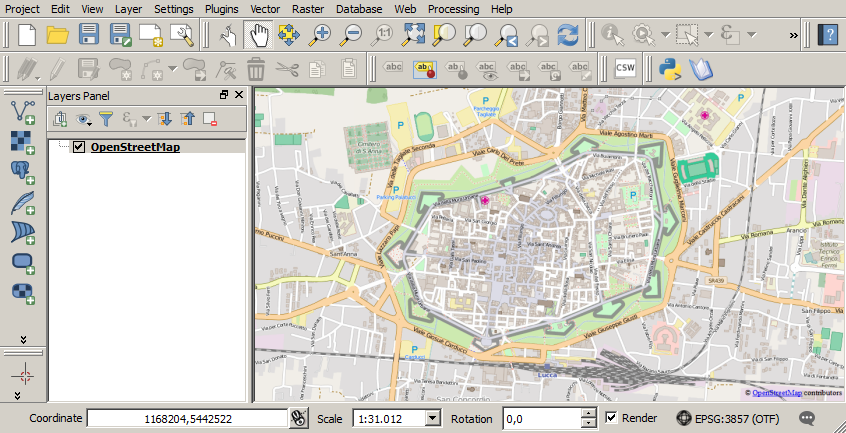
and them zoom-in over the geographic feature you want to model (a country boundary, a river, a street…)
I decided to model the Reinassence Fortification Wall of my wonderful city Lucca
-
Create a new vector layer using a Shapefile format.
HINT: Read something about the ancient Shapefile geospatial vector data format if you never heard about it.
from the top menu select:
Layer->Create Layer->New Shapefile Layer ...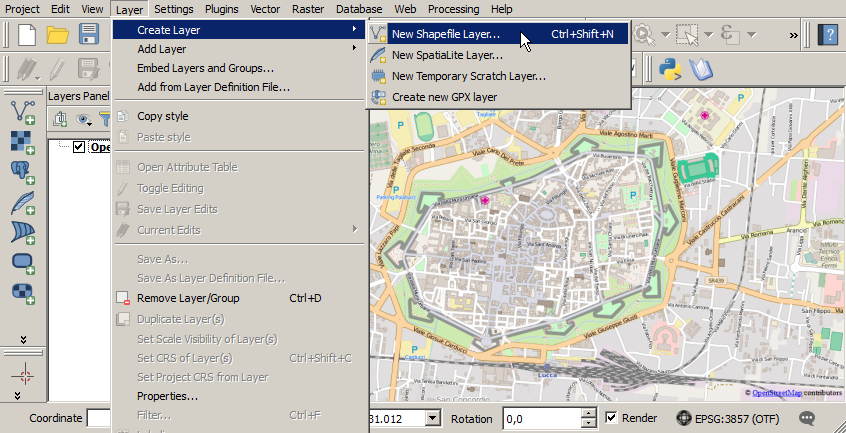
Fill-in the information about the
Geometry TypeandAttributes(aka fields) in the following dialogue box as shown below:Then press OK and type your output file name and select the location. We choose the name
mura.shp. Other files will be created with the same name but with different extensions, we will have a look on them at the end of the tutorial.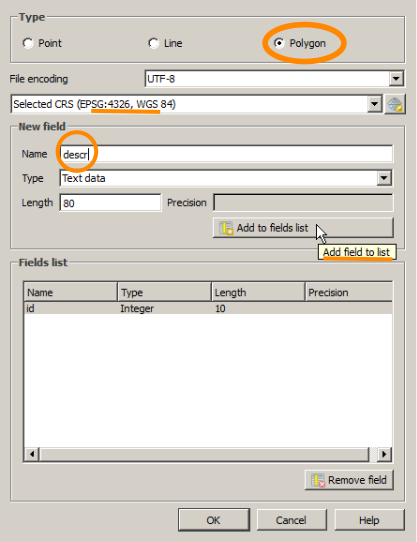
-
Now it’s time to draw a polygon:
Select the created layer on the QGIS Layers menu then click on * the orange pencil ( 1 ) button to activate the editing of the layer * The odd green and yellow button ( 2 ) to add a new feature. * Use the cursor to draw the polygon… In this example we draw a quite complicated polygon tracing the perimeter of the Lucca’s Furtification Wall.
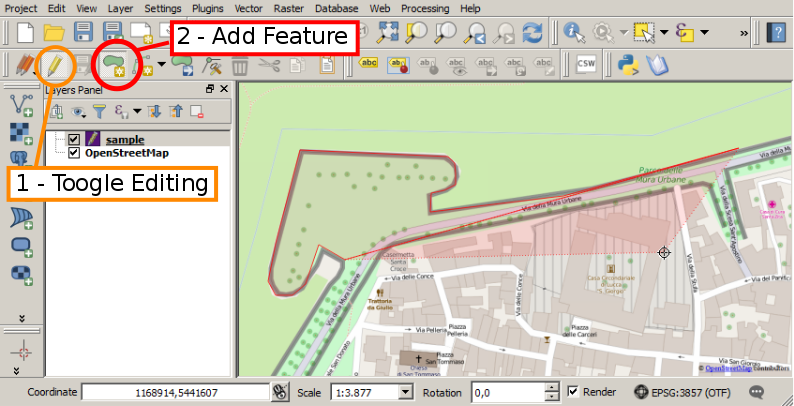
When we have closed the polygon a dialogue box will appear: here is the place to fill-in the attributes value of our features.
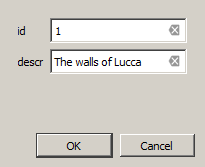
Et voilà, le jeux sont fait!
We have traced a geometry representing an architectionical feature of a city and we can easily incorporate it in any map we wanna create.
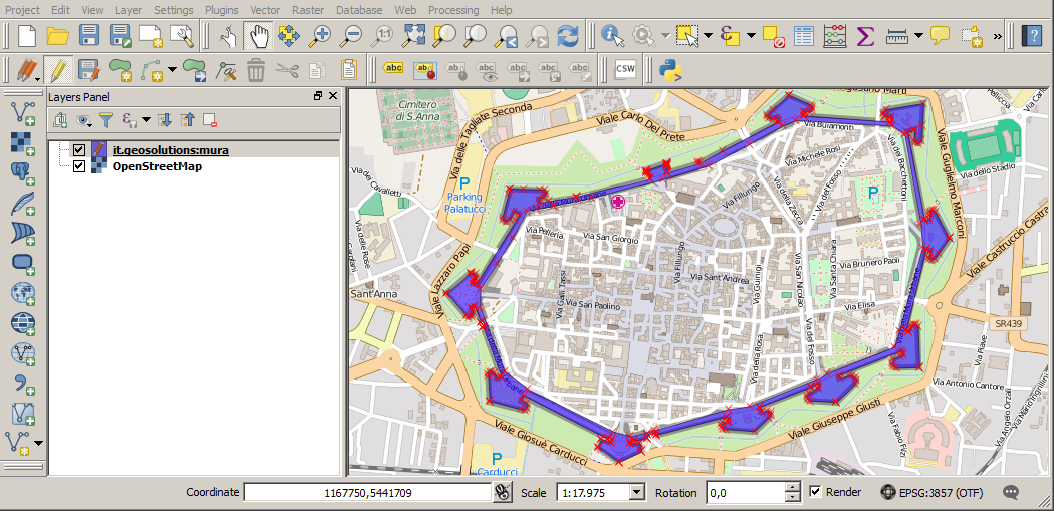
Don’t forget to Save the progress deselecting the orange pencil button.
Then have a look on the file system how our vector dataset saved as a shapefile is stored
We have 4 core files representing the basic and mandatory Shapefile components.

-
.shp shape format; the feature geometry itself
-
.shx shape index format; a positional index of the feature geometry to allow seeking forwards and backwards quickly
-
.prj projection format; the coordinate system and projection information, a plain text file describing the projection using well-known text (WKT) format
-
.dbf attribute format; columnar attributes for each shape, in dBase IV format.
As you can see it is automatically associated to a spreadsheet. I suggest to change its content only with GIS tools like QGIS although sometimes use a stylesheet could be usefull. If you want to use a stylesheet be sure that the software you use supports the dBase IV database specifications.
Some programs creates also few more files, always with the same filename but different extension: those serve for advanced indexing or other vendor capabilities.
-
Summary
Celebrate! You created your first geospatial Layer from scratch!
In this post we have learnt to create a custom vector geospatial dataset which can be used as a layer of geospatial features in any maps.
The basics tools introduced have been QGIS and its Openlayer plugin plus the Shapefile format.
In the next post we are going to see how to build up a production geospatial infrastructure to host our custom layer using some DevOps tools.
